
LLM tracing records the connected stages of an AI request, so teams can see what happened, where latency or errors arose, and which prompts, retrieval results, evidence, and tool actions shaped the final output. It isn't a complete quality program, but it gives engineers the operational feedback loop and evidence trail they need to improve one.
A familiar incident starts with a support ticket: a customer received an incorrect answer, and another customer waited too long for a response. The application returned successful HTTP responses, infrastructure dashboards looked normal, and the team could see the final text. What they couldn't see was whether retrieval returned weak documents, prompt assembly dropped key context, a tool timed out, or the model generated an answer unsupported by the available evidence.
That gap is why LLM tracing matters. It treats a generative AI request as a connected execution path rather than a single model call. The trace can connect user input, retrieval, prompt construction, inference, tool execution, and response delivery, allowing the team to investigate causality instead of guessing.
Why AI Teams Cannot Explain Production Behavior
A production AI incident rarely arrives in a clean technical form. A customer says the assistant “made something up.” A sales representative reports that the same workflow feels slow for one account but normal for another. An operations manager notices that a tool-using agent completed its task, but the resulting record is incomplete.
The application log may show a request ID, a status code, and a final response. That confirms that the request finished. It doesn't explain how the system reached the answer.
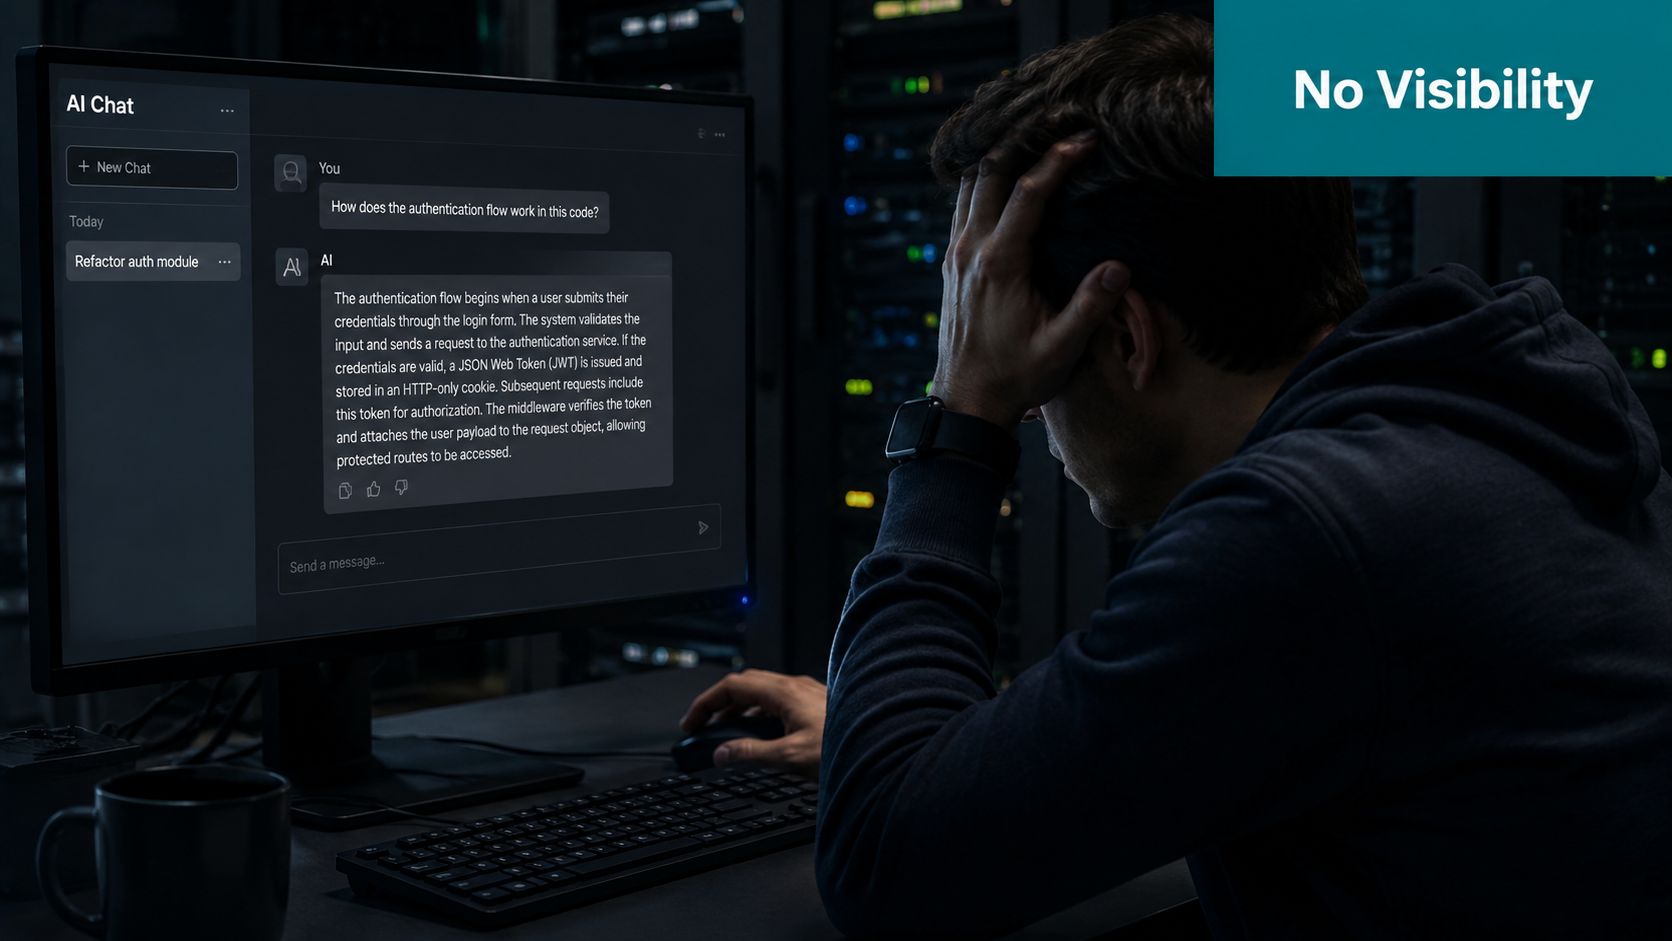
Traditional application monitoring is good at answering questions such as whether a service is available or whether a request failed. Generative AI needs a deeper operational story. A successful response can still contain an irrelevant retrieval result, an incomplete prompt, an unnecessary model call, a malformed tool argument, or an answer that conflicts with the source material.
The black-box request creates business risk
Without connected spans, engineers often inspect separate logs from the application, vector database, model gateway, and tool services. Those records may use different identifiers or timestamps, making it difficult to reconstruct the request. Teams lose time correlating fragments manually, while product leaders see only the downstream consequences, such as support escalations, abandoned workflows, or lower user trust.
A trace preserves the causal relationship across those stages. It can show that retrieval completed successfully but returned poor context, or that the model responded quickly while a downstream tool contributed most of the delay. This distinction matters because the fix differs in each case.
Practical rule: If the team can't connect a final answer to the operations that produced it, it can't reliably explain a production failure.
Tracing also has a boundary. It shows what the system did, not automatically whether the output was correct, safe, useful, or commercially valuable. Teams should pair trace evidence with evaluations, human review, customer feedback, and outcome measures. AI transparency practices can help leaders frame that wider accountability problem, but tracing remains the operational foundation.
Understanding the Key Concepts
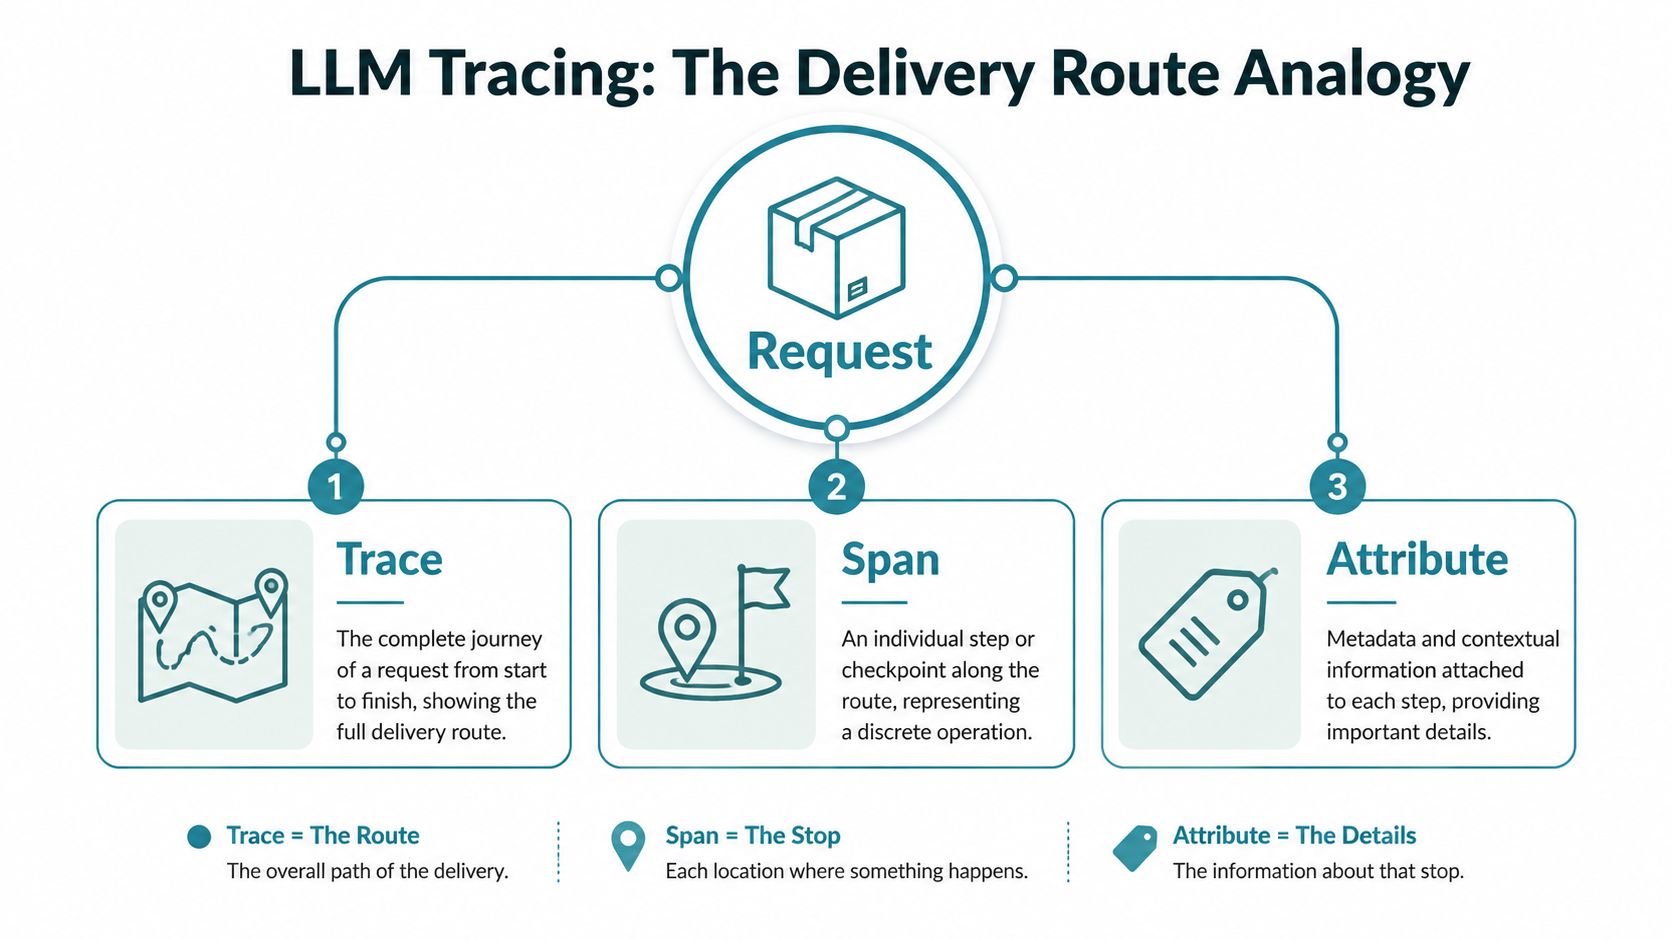
An LLM request travels through specialized services. The input payload is the request, and the trace records its full execution path from user query to final response. Each span marks a meaningful operation, such as preprocessing, retrieval, generation, or tool use. Together, these records form both an operations feedback loop and an evidence trail for explaining production behavior.
In a RAG application, spans can cover input handling, query preprocessing, document retrieval, reranking, context assembly, model generation, and response delivery. An agent workflow may also record planning, tool selection, external API calls, observation handling, and final action execution.
Read the route, not just the destination
A parent span represents a larger operation, while child spans show the work performed inside it. The parent may cover an entire assistant request, with children for retrieval, a model call, and a tool invocation. If retrieval fans out across services, related child spans can show those operations even when they run in parallel.
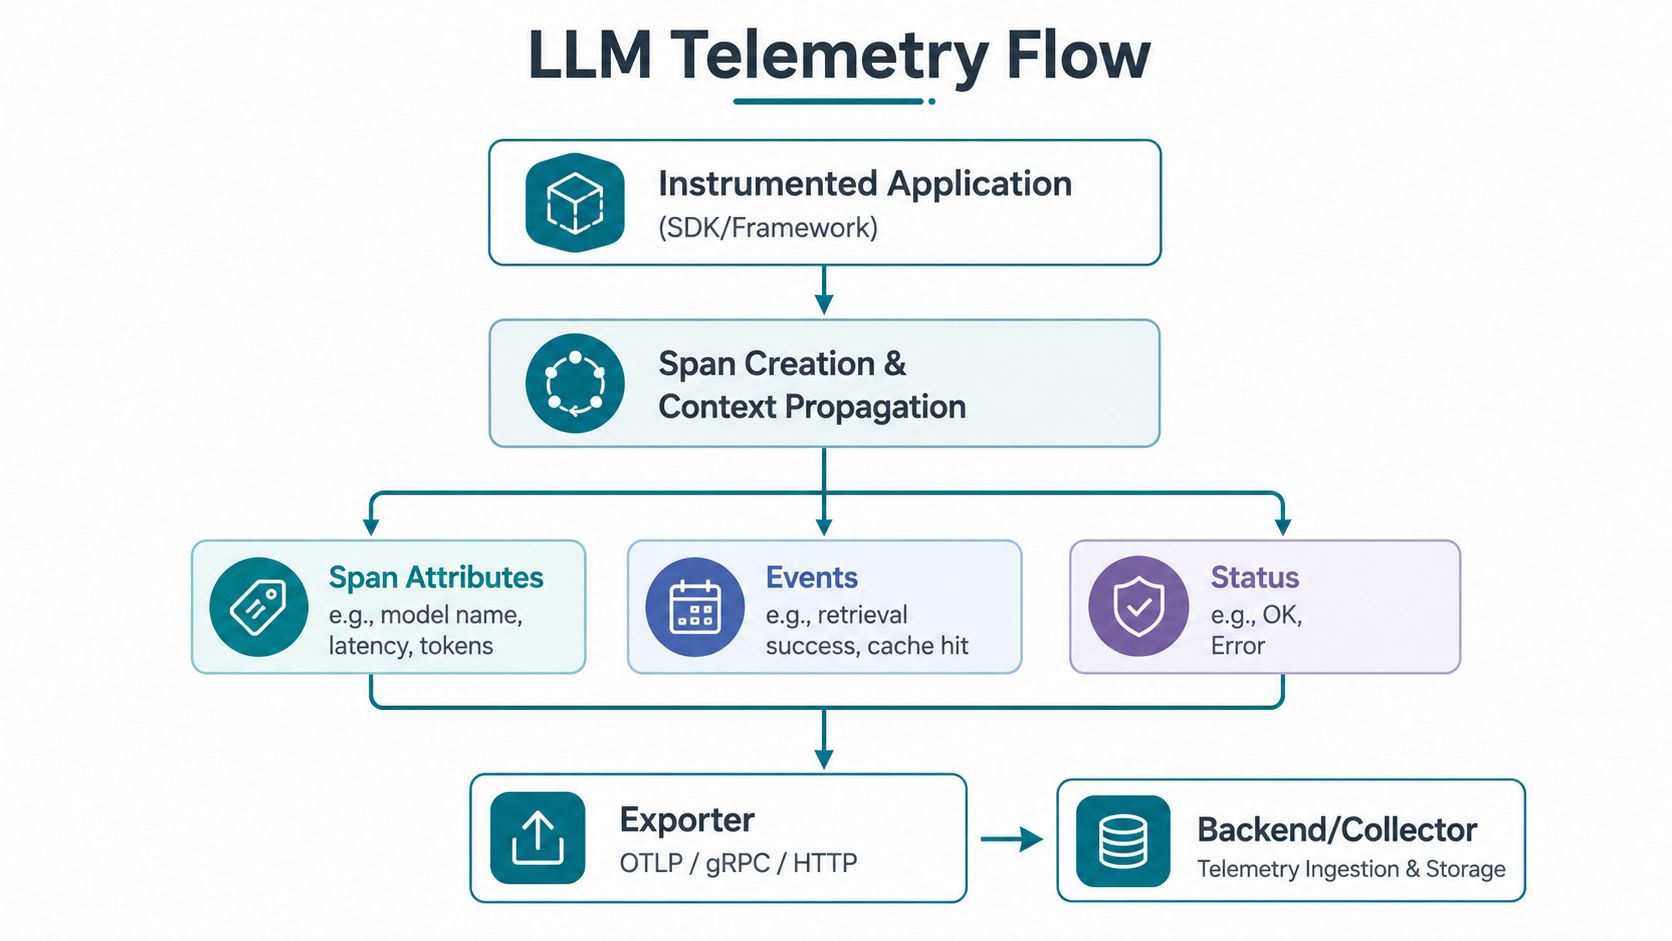
Attributes add context to each span. Useful fields include model name, token usage, operation duration, finish reason, provider, prompt version, retrieval index, tool name, and status. Events capture notable moments, including a cache hit, retrieval miss, retry, timeout, or tool validation failure.
Context propagation preserves the request's causal identity across service boundaries. The application passes trace context to a model gateway, which passes it to a retrieval service or tool orchestrator. A visual trace can then answer practical questions:
- Where did time accumulate? Compare the parent request duration with each child operation.
- Which input shaped the call? Inspect the relevant prompt and retrieval metadata, subject to privacy controls.
- Which dependency failed? Review span status, events, retries, and external service responses.
- What happened before the answer? Follow the parent-child sequence instead of treating model output as an isolated event.
A single model call is one checkpoint, not the whole workflow. Trace evidence becomes business-relevant only when teams connect it with evaluations, human feedback, customer outcomes, and governance controls. LLM evaluation services can help connect output scores with the execution behavior that produced them, while governance determines which data may be recorded and who can review it.
Tracing Architecture and Instrumentation Flow
A production tracing architecture begins in the application and ends in an observability backend. SDK or framework instrumentation creates spans around the request and its major operations. Context propagation carries trace identity through orchestration layers, model gateways, vector databases, tools, and response services. Enrichment adds attributes and events, then an exporter sends telemetry to a collector or backend.
OpenTelemetry supplies a vendor-neutral foundation for this flow. Its GenAI work has helped move LLM tracing from ad hoc logging toward shared conventions. The OpenTelemetry GenAI Special Interest Group began in April 2024, and OpenTelemetry published an introduction to LLM observability on June 4, 2024, describing tracing for event sequences in RAG-style applications. The later GenAI observability guidance covers fields such as model name, input and output token counts, finish reasons, and operation duration. OpenTelemetry's GenAI observability overview documents that progression.
Automatic and deliberate instrumentation
Automatic instrumentation is the quickest way to capture common model and framework operations. It creates spans for supported libraries with limited application changes. Use it as a baseline, then add deliberate instrumentation where business decisions occur.
Manual instrumentation should cover prompt-template selection, document filtering, authorization checks, tool approval decisions, fallback routing, and final action persistence. These stages often determine whether a request was useful or risky, yet a library cannot infer their significance reliably. For teams building complex orchestration, see our guide on AI orchestration platforms.
| Component | Responsibility | Instrumentation Consideration |
|---|---|---|
| Application entry point | Accepts the user request and establishes trace context | Capture a correlation ID and workflow name, while minimizing sensitive input |
| Orchestrator | Coordinates retrieval, model calls, tools, and response handling | Create parent-child spans that reflect actual causal order |
| Model provider or gateway | Sends inference requests and receives outputs | Record model identity, token counts, finish reason, status, and duration |
| Retrieval layer | Searches, filters, and ranks context | Capture query metadata, result identifiers, ranking signals, and retrieval timing |
| Tool services | Execute external actions or fetch live data | Record tool name, validation status, result status, retries, and errors |
| Collector and backend | Receives, stores, indexes, and visualizes telemetry | Apply redaction, access controls, retention rules, and sampling policies |
Nested spans preserve dependency relationships that a flat log stream loses. OpenTelemetry-based LLM tracing represents each step as a nested span and standardizes attributes such as model name, token usage, and latency. Engineers can instrument once and route the same telemetry to multiple observability tools without rewriting application code, as explained in this OpenTelemetry LLM tracing guide.
Separate collection from analysis. The application emits structured telemetry, while a collector processes or redacts it. The backend supports search, trace visualization, aggregation, evaluation attachment, and incident investigation. This boundary reduces vendor coupling and makes schema governance easier.
A trace is both an operations feedback loop and an evidence trail. It shows where execution slowed or failed, while evaluations, human feedback, customer outcomes, and governance controls determine whether the workflow produced acceptable business results. Use tracing alongside those controls, not as a substitute for them.
Business Value of End-to-End Visibility
Tracing earns its place in a production stack when it supports decisions. The strongest business case isn't “we can see more telemetry.” It's “we can identify the cause of a costly failure, assign ownership, and verify whether the fix improved the workflow.”
Five jobs tracing performs well
Faster debugging is the immediate benefit. If users report slow responses, span timing can identify whether the delay came from retrieval, model inference, a tool, retries, or orchestration overhead. Engineers can target the responsible stage instead of changing prompts or infrastructure at random.
Operational observability gives leaders a view of how AI features behave under real workloads. Teams can compare latency, error types, model usage, retry patterns, and workflow paths across products or customer segments. That visibility supports capacity planning and incident response.
Evidence tracing is more important for agents than many standard explainers acknowledge. A trace should help answer which documents were retrieved, which tools ran, which intermediate actions occurred, and which evidence supported the final response. A recent survey describes this as a “process-level accountability gap”, because reliable agents need traceability for where answers come from and where unsafe influences entered the execution path. The survey on agent process accountability provides the relevant research context.
Governance support comes from reconstructable execution history. An auditor or security investigator may need to understand which model, data source, tool, and policy path contributed to an output. Tracing can supply that evidence, but it doesn't establish compliance by itself.
Business measurement connects technical behavior to outcomes. Attach traces to successful resolutions, completed tasks, throughput, cost per completed task, retention signals, or conversion impact where those measures fit the product. A trace becomes valuable when someone uses it to decide what to change.
Visibility does not equal quality
Grafana's 2025 observability survey found that only 7% of organizations were using LLM observability in production. A separate 2026 article cited in the verified data notes that only 15% of GenAI deployments instrument observability at all. These figures show that adoption remains early and fragmented, not that tracing alone creates business value. Grafana's observability survey takeaways supports the first figure.
The practical response is to choose one high-value workflow and define the decision attached to its telemetry. Add trace-backed evaluations, structured human feedback, and outcome data. If the team can't say what action a trace will support, it shouldn't collect every possible field yet.
RAG Pipelines and Agent Workflow Examples
A trace becomes easier to design when the team maps the request as a story. Consider a customer-support RAG assistant. The trace begins when the user submits a question and ends when the application delivers a response.
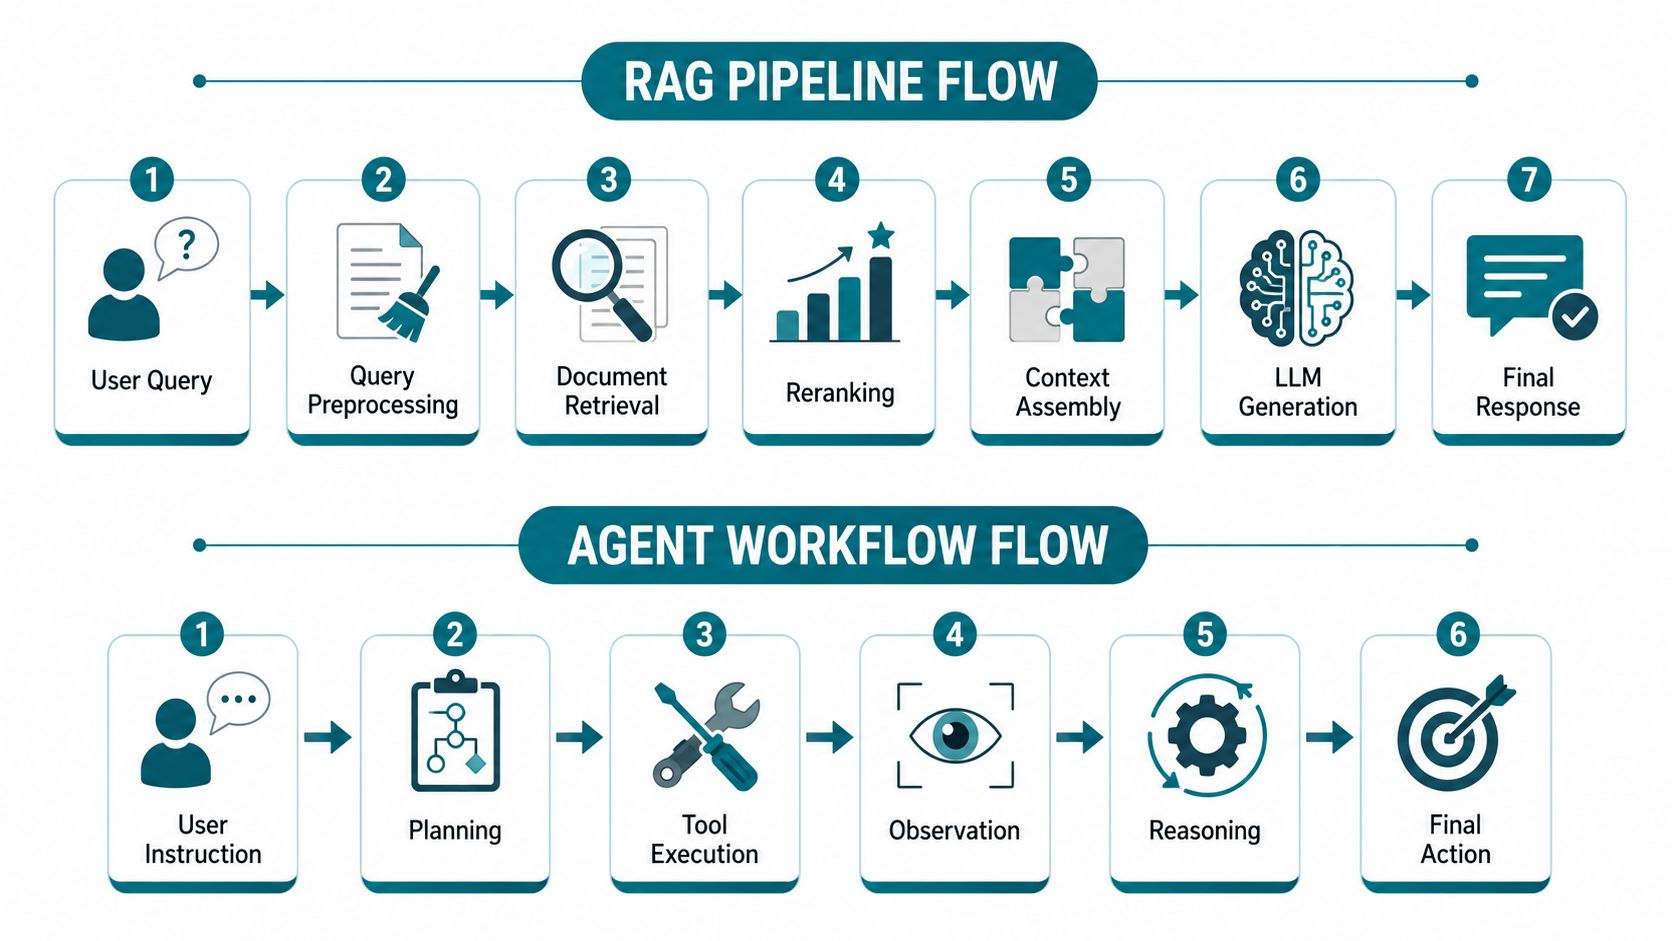
Example one, a RAG request
The parent trace can contain these child spans:
- Input handling: Record the workflow, tenant context, request correlation, and approved input metadata.
- Query preprocessing: Capture the normalized query, classifier result, or rewrite version, with sensitive content redacted where necessary.
- Document retrieval: Record the retrieval operation, index, filters, result identifiers, and duration.
- Reranking: Capture the reranker identity, candidate set metadata, and selected document identifiers.
- Context assembly: Record which passages entered the prompt, their source identifiers, and the prompt-template version.
- Model generation: Record the model name, token counts, finish reason, duration, and status.
- Response delivery: Capture streaming or delivery status and connect the final output to the evaluation record.
Suppose the answer is wrong. The trace can distinguish a retrieval problem from a generation problem. If the correct policy document never appeared among the retrieved results, changing the prompt won't solve the root cause. If the correct evidence entered the context but the answer contradicted it, the team should investigate prompt construction, model behavior, or evaluation coverage.
The RAG pipeline architecture guide offers useful background for teams mapping these stages. The key tracing decision is to preserve source identifiers and relationships, not merely store a large undifferentiated prompt.
Example two, a tool-using agent
An agent trace starts with the user instruction, then records planning, tool selection, tool execution, observation handling, reasoning or state transitions, and final action. Each tool call deserves its own span with the tool name, validated arguments, authorization outcome, external response status, retry behavior, and resulting state change.
A malformed tool argument should be visible as a tool-validation failure, not buried inside a generic agent error. An unexpected model call should show which parent operation initiated it. A slow workflow should reveal whether the agent repeated a tool call, waited on an external system, or took an unnecessary planning path.
Tracing should also preserve execution provenance. Record which retrieved sources, tools, intermediate actions, and external results supported the answer or action. Avoid capturing unrestricted hidden reasoning or confidential payloads by default. The objective is an auditable process record that supports investigation and evaluation, not indiscriminate collection of every internal token.
Metrics and Signals That Make Traces Useful
A trace database becomes an operating system only when each signal supports a daily decision. Collecting everything without clear owners creates noise, increases storage exposure, and produces dashboards that teams stop trusting.
| Signal Category | Examples | Decision Supported |
|---|---|---|
| Request timing | End-to-end duration, queue time, streaming completion | Set service expectations and locate workflow bottlenecks |
| Span timing | Retrieval, reranking, model, and tool duration | Assign optimization work to the responsible stage |
| Model usage | Model name, input and output token counts, finish reason | Compare model behavior and manage usage patterns |
| Retrieval behavior | Query metadata, result identifiers, filtering, ranking | Investigate weak context and source coverage |
| Tool execution | Success, validation, retries, timeout, external status | Improve reliability and approval controls |
| Errors and retries | Error type, failed span, retry count, fallback path | Separate transient dependency issues from application defects |
| Quality signals | Evaluation score, reviewer label, user feedback | Judge whether observed behavior produced an acceptable output |
| Business outcomes | Successful resolution, completed task, conversion impact | Connect AI performance to product value |
Use standardized fields where available so teams can compare traces across observability backends. These fields improve consistency, but they do not prove that an answer was correct, safe, or useful. Treat tracing as an operations feedback loop and an evidence trail, then pair it with evaluations, human feedback, and governance controls.
Tracing differs from adjacent telemetry:
- Logs capture discrete messages and diagnostic details. They can explain an event, but often lack the connected hierarchy of a full AI workflow.
- Metrics aggregate behavior into trends and alerts. They show that latency or failures changed, but not necessarily which request path caused the change.
- Evaluations judge outputs against criteria such as correctness, relevance, safety, or groundedness. They need trace context to explain poor scores.
- Human feedback records user or reviewer judgment. It can reveal problems automated checks miss, provided the feedback remains linked to the relevant trace.
Start with a baseline for the chosen workflow. Aggregate results by model, workflow, tenant class, tool, retrieval path, and prompt version. Use representative sampling for expensive payloads, while retaining enough complete traces to investigate failures. Alert only on changes that trigger action, such as more timeouts, repeated tool failures, or a quality regression tied to a deployment.
Assign each alert an owner and a response path. A latency increase may require capacity work, while a groundedness decline may require retrieval or evaluation changes.
Do not optimize token use in isolation. Lower usage can reduce expense while harming answer quality. Measure the relationship among quality, latency, cost, throughput, and completed outcomes. That relationship determines whether an AI feature improves the product rather than merely reducing infrastructure spend.
Security Privacy and Governance Controls
Detailed traces can become a new data-exfiltration path. Prompts, retrieved documents, outputs, user identifiers, tool parameters, and intermediate actions may contain personal, confidential, regulated, or commercially sensitive information.
Before expanding collection, classify every field. Decide what the team needs to debug and what should never leave the application boundary. Redact or tokenize sensitive content before export, and prefer metadata such as document identifiers over unrestricted document bodies when full content isn't required.
Controls for responsible collection
- Minimize capture: Store only the content needed for the operational decision.
- Redact early: Apply masking before telemetry reaches a vendor backend or shared collector.
- Restrict access: Use role-based permissions, separate production and development data, and log access to sensitive traces.
- Protect storage: Encrypt telemetry in transit and at rest, with retention limits tied to the use case.
- Review processors: Confirm deployment region, subprocessors, contractual terms, and data-handling responsibilities with legal and security teams.
- Govern the schema: Assign ownership for new attributes, version changes, and deprecation.
- Prepare response procedures: Define how the team investigates, exports, deletes, and quarantines trace data after an incident.
A trace can support an audit or investigation, but it doesn't prove regulatory compliance. Compliance depends on the complete control environment, including policies, access management, contractual safeguards, risk assessments, and evidence that controls operate as designed. Teams building that foundation should treat AI governance best practices as a broader discipline than observability alone.
Enterprise Adoption Checklist and Next Steps
Start with one consequential workflow, such as a support RAG assistant or a tool-using internal agent. Write down the decision the team needs to make, then instrument only the stages required to support it.
- Map the path: Connect input, retrieval, prompts, model calls, tools, and final outcomes.
- Standardize telemetry: Use consistent names for models, workflows, tokens, duration, status, sources, and tool actions.
- Protect data: Exclude or redact sensitive content before export.
- Add judgment: Link traces to evaluations, human review, customer feedback, and outcome measures.
- Set a baseline: Track accuracy, throughput, cost, latency, or revenue impact according to the workflow.
- Run a bounded pilot: Expand only when the telemetry changes a decision or improves an agreed KPI.
The best first trace is the shortest trace that supports a consequential decision. If your team needs help defining that decision, assessing data maturity, and creating a phased AI operating plan, AmasaTech can begin with an AI audit and connect implementation to measurable outcomes.
AmasaTech helps teams audit AI readiness, design traceable RAG and agent workflows, and pair observability with evaluations, governance, and human feedback. Visit AmasaTech to discuss a focused pilot tied to the KPI your business needs to improve.